of timber are disturbed annually.
European Forest Institute, 2022
Monitoring forest health
Detecting forest pest, disease, and drought stress traditionally relied on extensive ground inspections, a costly, time-consuming effort that covers only a fraction of the landscape. It’s impossible to inspect every stand, leaving critical blind spots.
As a result, managers must make high-stakes decisions with incomplete and delayed information.
Acting too late can lead to widespread tree loss, rising costs, and significant economic and ecological damage.
They need timely, landscape-scale insight to detect early warning signs, prioritise field visits, and target interventions before small problems become large-scale losses.
Copernicus can help
Early detection guides forest managers’ critical decisions; when to thin dense stands, adjust irrigation, conduct controlled burns, or restrict access.
Copernicus Earth Observation data provides managers with consistent, landscape-scale monitoring that helps detect early signs of stress, enabling forest managers to identify emerging risks. Satellite images contain millions of pixels that record information about the Earth’s surface.
These pixel values are processed with algorithms to calculate numerical measurements (for example vegetation condition or soil moisture).
The measurements are then converted into indicators, which summarise the situation in a simple way. Finally, these indicators are visualised as maps, charts, or dashboards, allowing users to quickly understand trends and support decision-making without needing to interpret the raw satellite images.
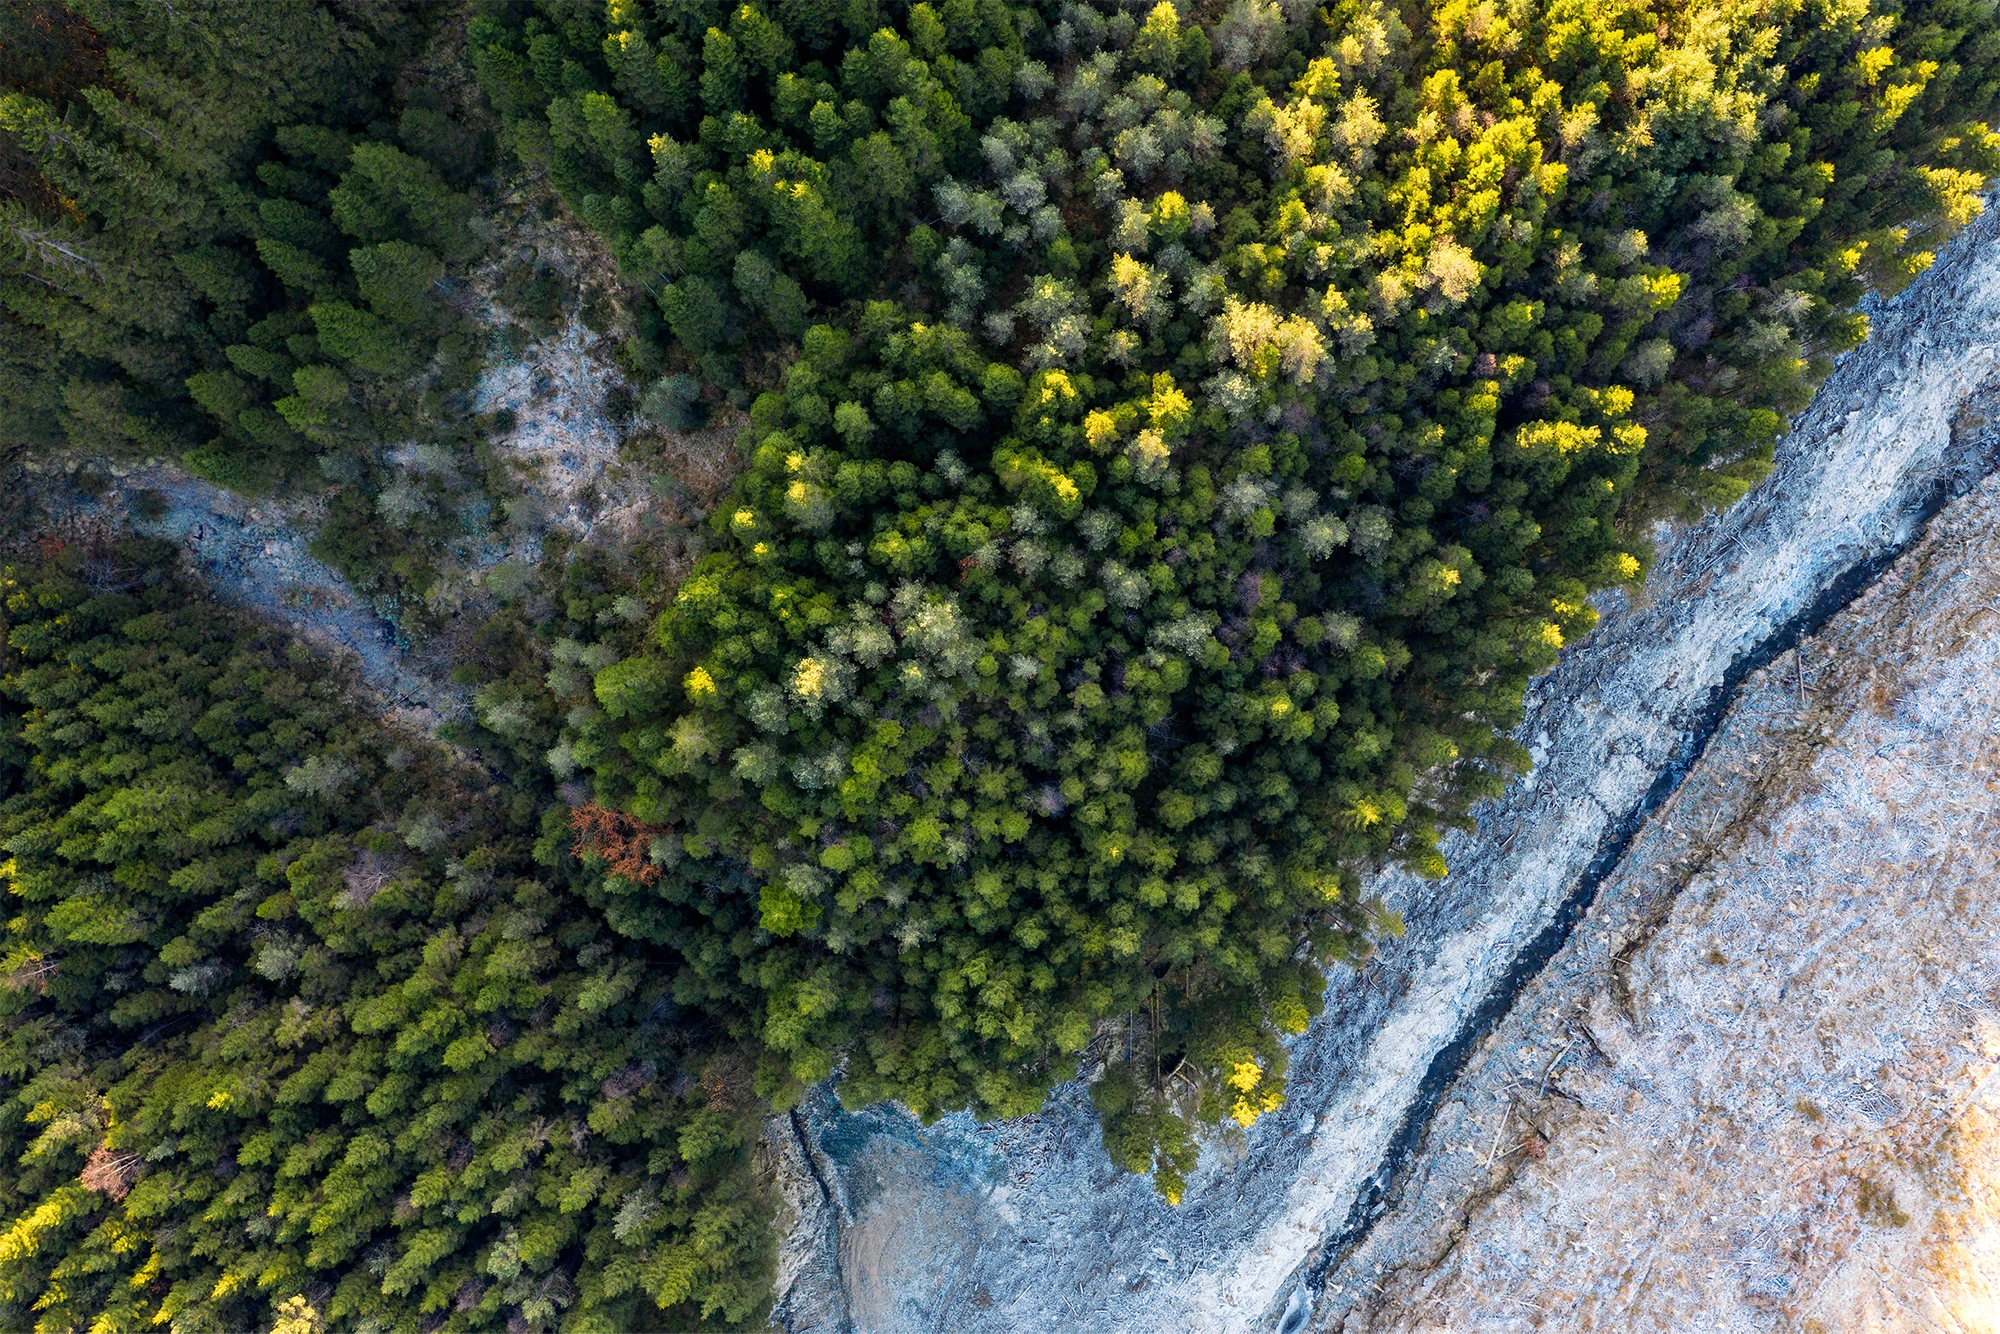
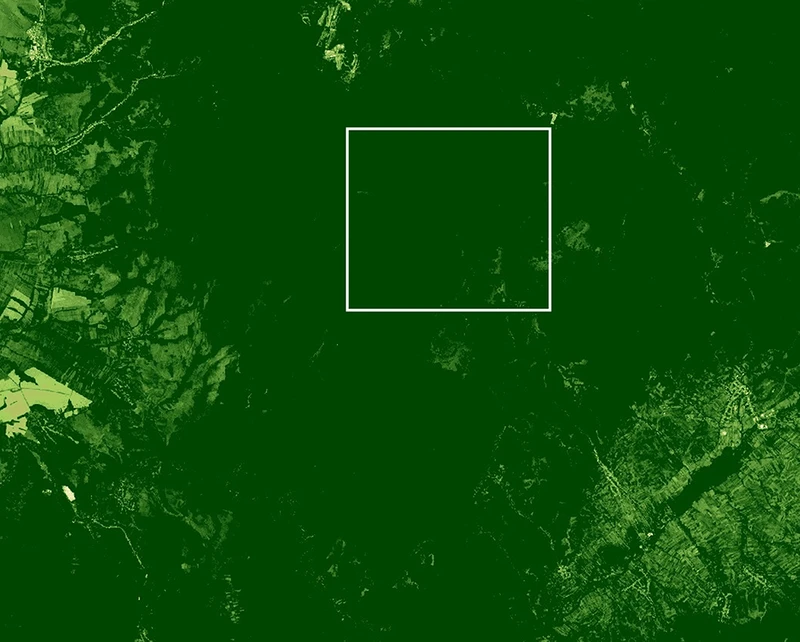
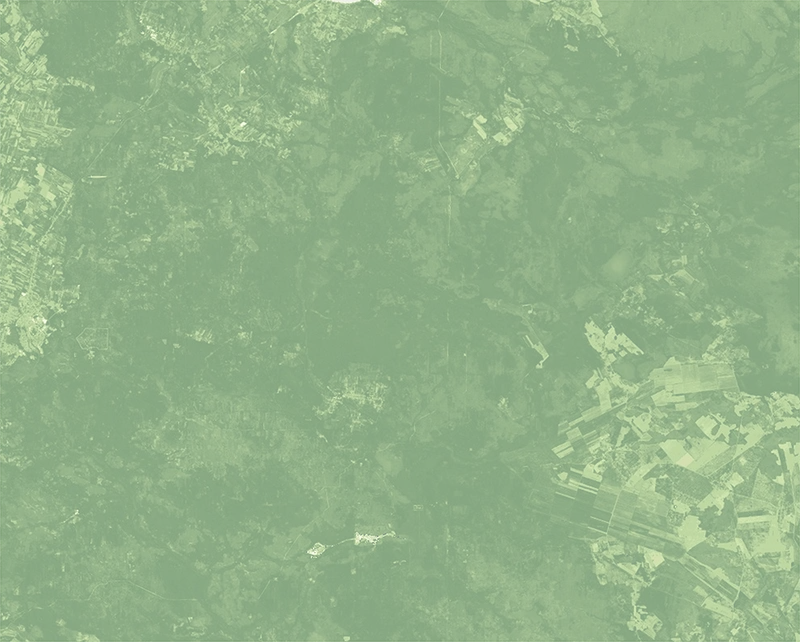
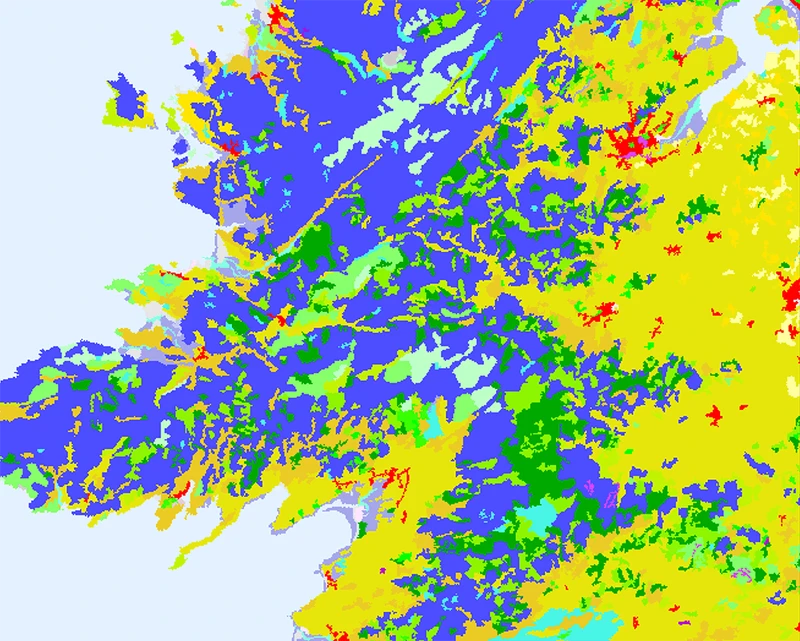
NDVI (Normalized Difference Vegetation Index) uses colours to show how healthy and dense vegetation is. Dark green indicates very healthy, dense forest vegetation and biomass. In comparison, light green and yellow indicate sparse, stressed or degraded vegetation.
(Ardennes forest, Belgium - 2024) - source

Forest vegetation health
Monitoring the health of large forests is challenging, as ground inspections alone cannot easily detect early signs of stress or decline across wide areas. To address this, forest managers can use satellite imagery from Sentinel-2 to monitor vegetation condition across entire landscapes.
Sentinel-2’s multispectral sensors measure how vegetation reflects light in visible and near-infrared wavelengths. Healthy plants typically absorb red light for photosynthesis and strongly reflect near-infrared light. These signals are processed into vegetation indices such as the Normalized Difference Vegetation Index, which provide clear maps of differences in forest vigour, canopy density, and photosynthetic activity, helping managers identify areas that may require further attention.
Sentinel-1 can monitor forest health by detecting changes in radar backscatter related to canopy structure and moisture, helping identify stress, disturbance, or degradation.
Because its radar penetrates clouds and captures data even at night, it provides reliable year-round monitoring that complements optical data.
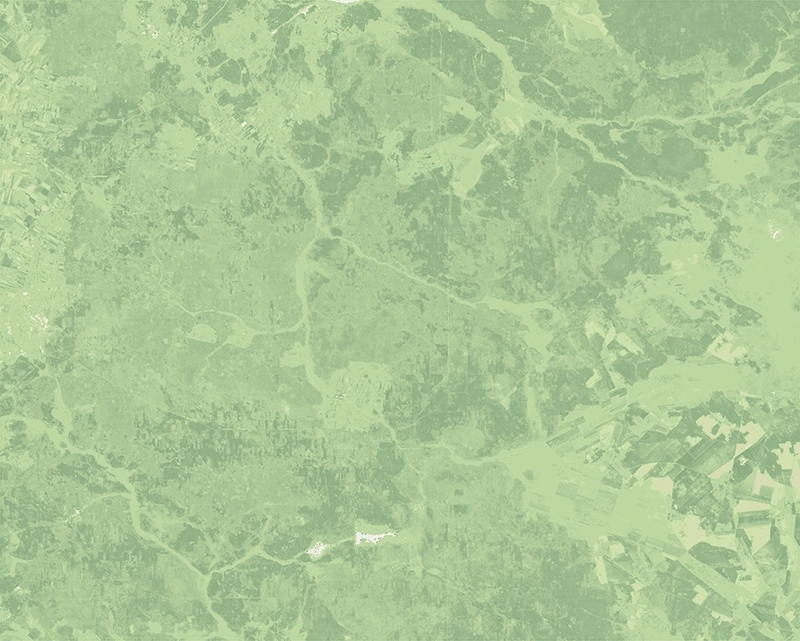
Satellite data can highlight areas of reduced vegetation performance, even in remote forests where field surveys are limited. Frequent satellite revisits allow time-series analysis, helping forest managers track changes over time and focus field inspections on areas showing potential stress.
Normalized Difference
Vegetation Index (NDVI)
Enhanced
Vegetation Index (EVI)
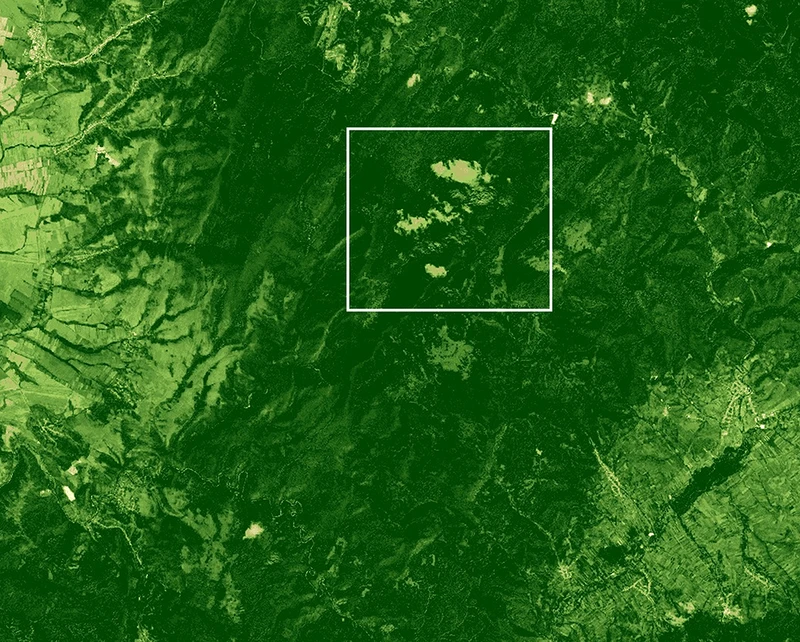
Areas of lighter green/yellow appearing over time indicate loss of tree cover” (Parcul, Romania)
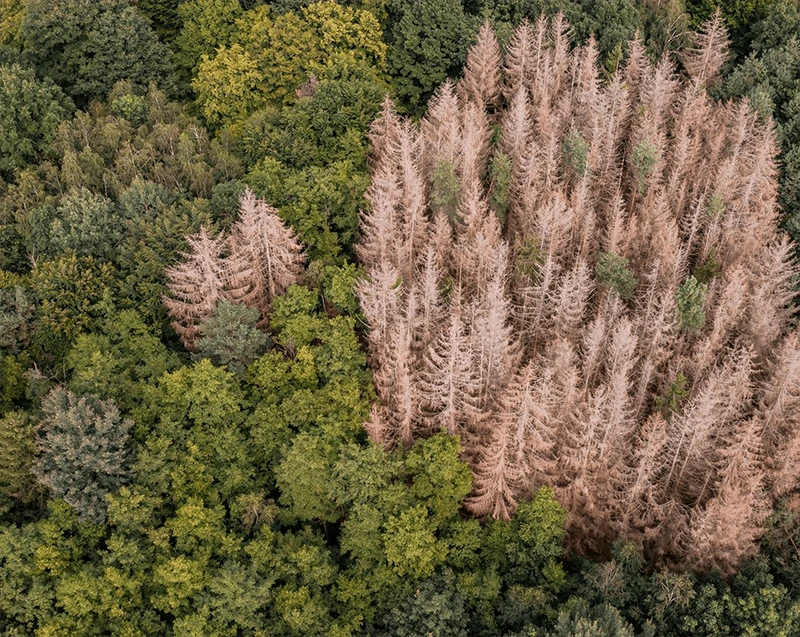
Forest pests
Insect damage reduces chlorophyll levels, alters leaf structure, and can lead to defoliation, all of which are detectable through vegetation indices such as Normalized Difference Vegetation Index (NDVI) or Normalized Difference Red Edge (NDRE).
These indicators allow stressed or declining forest stands to be identified before damage becomes visible from the ground.
This information is especially important for forest managers, as it supports early warning, targeted field inspections, and more efficient allocation of resources. By tracking pest-related stress over time, managers can distinguish outbreaks from normal seasonal changes, monitor how infestations spread, and evaluate the effectiveness of control measures.
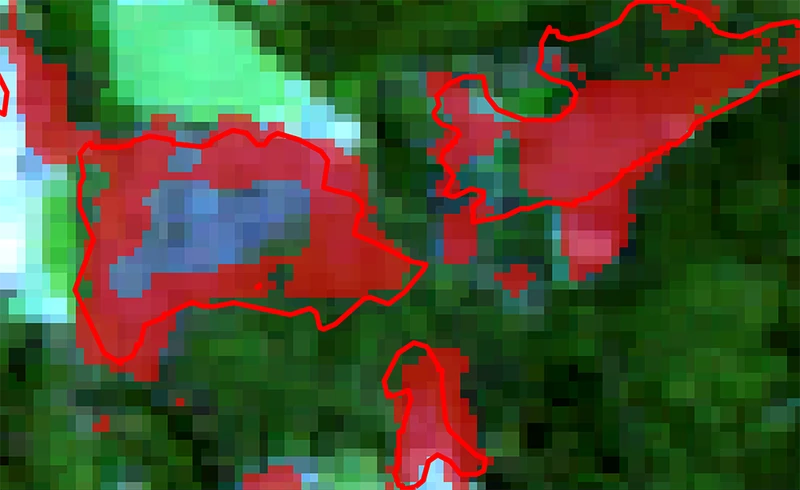
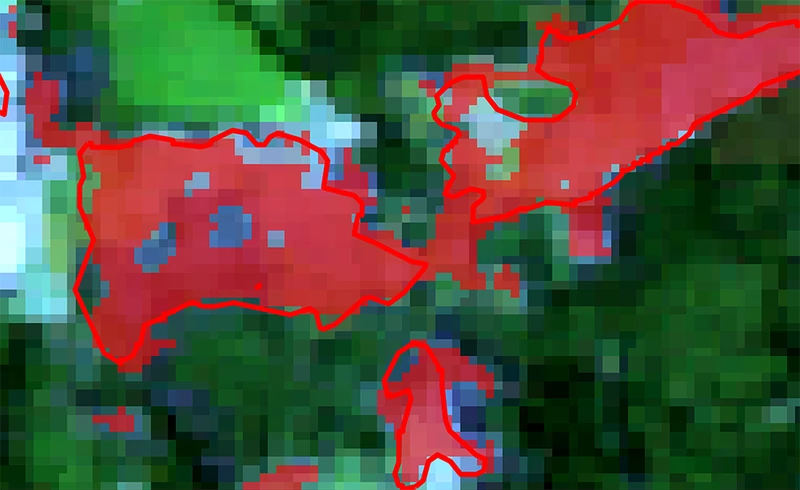
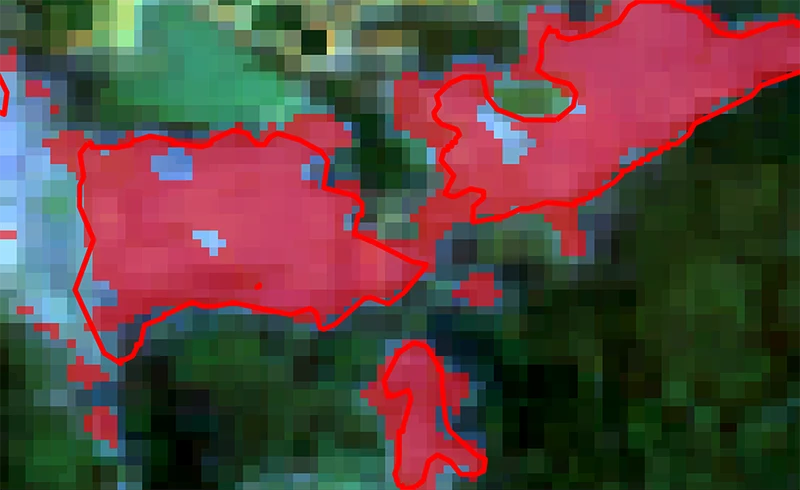
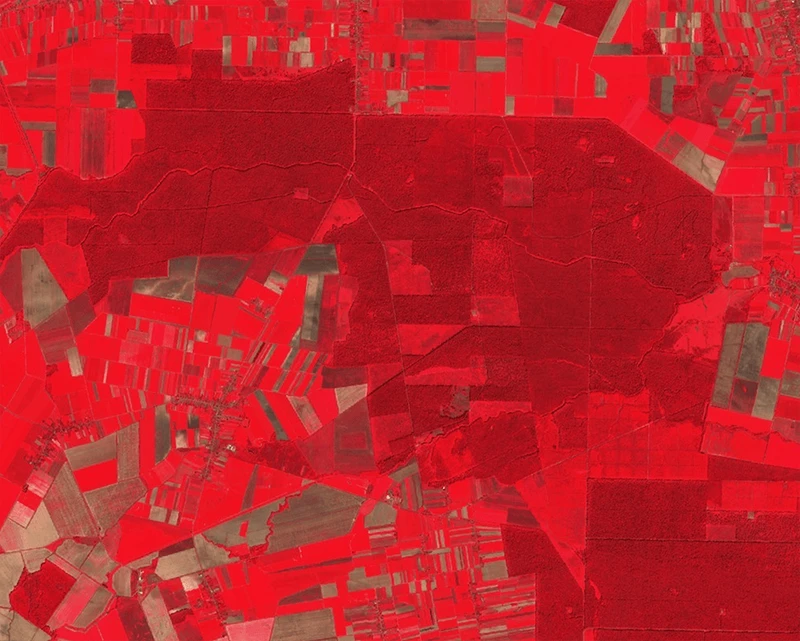
For example, the EU-funded SWIFTT project has observed damage caused by bark beetles across various regions in Europe.
Moreover, the project has explored damage assessment with AI, as shown in these images, allowing for the automatic identification of damaged forest areas, which enables forest managers to take prompt action to limit the damage.
Bark Beetle Damage in Czech Forests –July, August, September 2020 – Bright red lines outline the study areas, while dark red pixels show bark beetle damage spreading inside and beyond them.
(credit SWIFTT project)
Tree disease
Many tree diseases also reduce photosynthetic activity, cause leaf discolouration, thinning crowns, or premature leaf loss, all of which lead to measurable changes in vegetation indices such as NDVI and NDRE derived from Sentinel-2.
Tree diseases such as ash dieback, sudden oak death, Dutch elm disease etc. can be monitored indirectly using Sentinel data. While satellites do not identify the pathogen directly, they reveal the characteristic stress patterns caused by these diseases.
This landscape-scale perspective helps forest managers reduce losses, protect biodiversity, and support sustainable forest management under increasing environmental pressures.
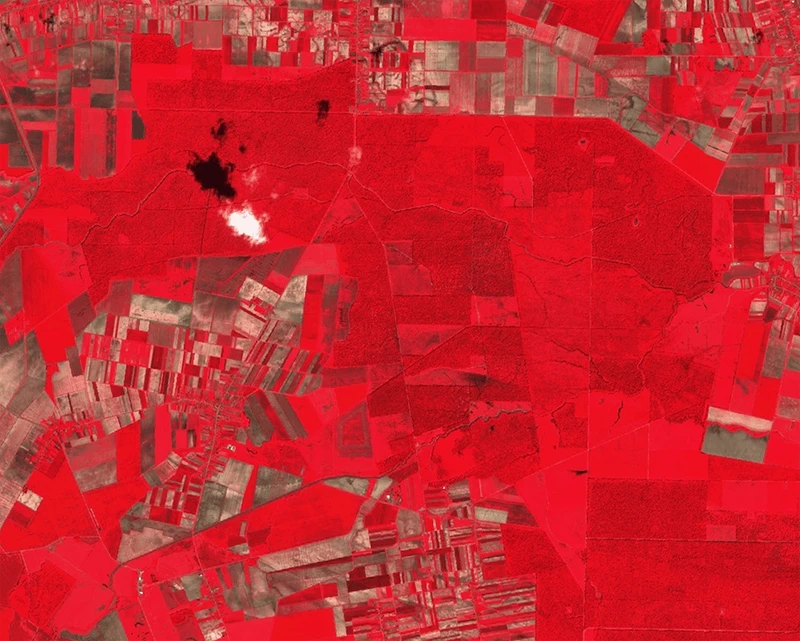
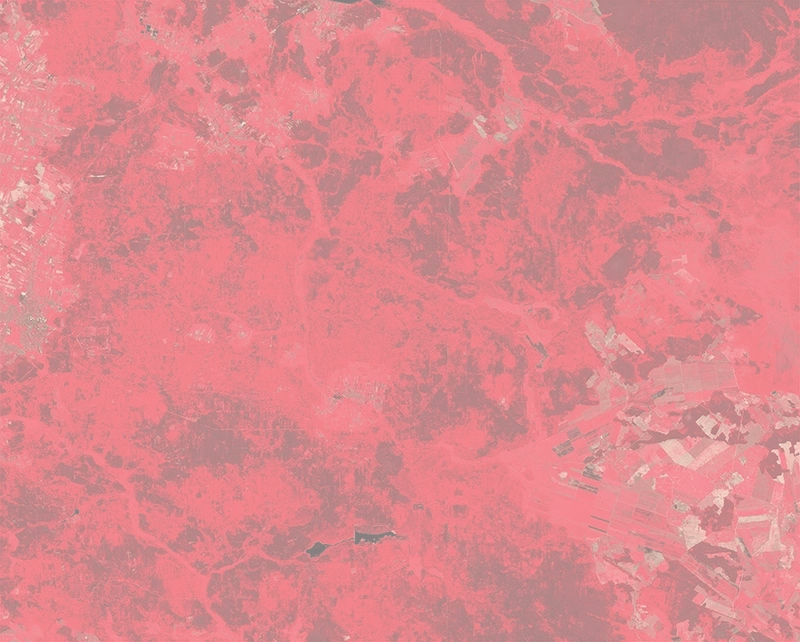
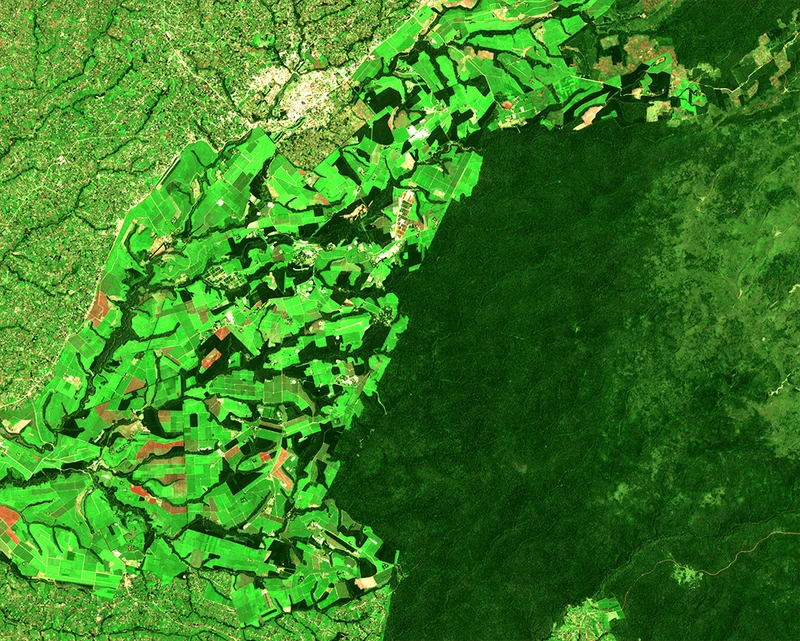
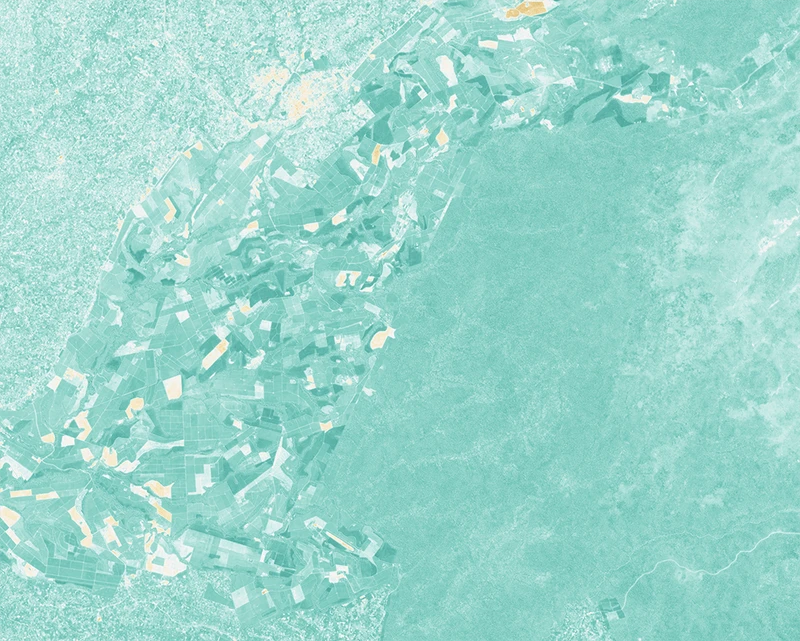
Maps that utilize the Near-Infrared band show changes in forest health through colour intensity: areas with bright or intense reds indicate healthy trees that strongly reflect near-infrared light, while darker or duller colours indicate stressed, damaged, or sparse vegetation that reflects less. (Ash dieback disease, Croatia, – NIR-Red-Green false colour) - Image source
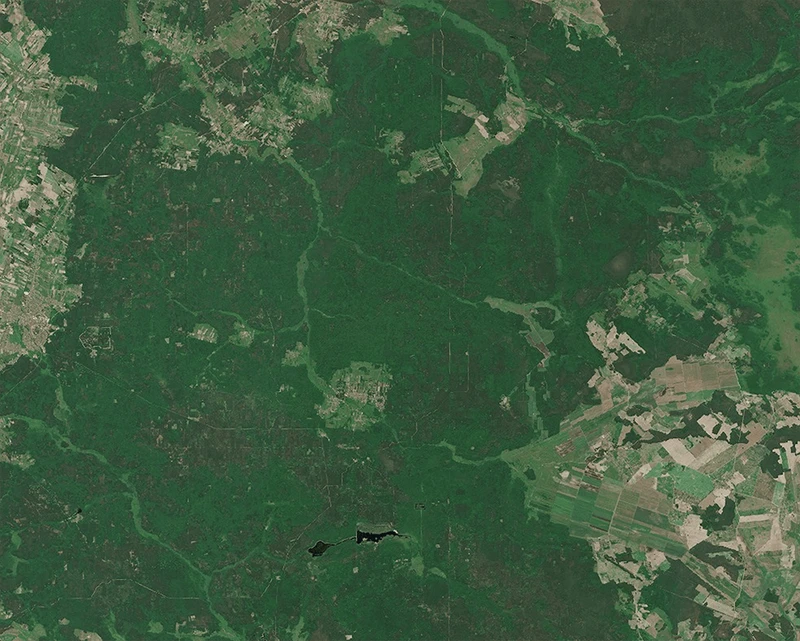
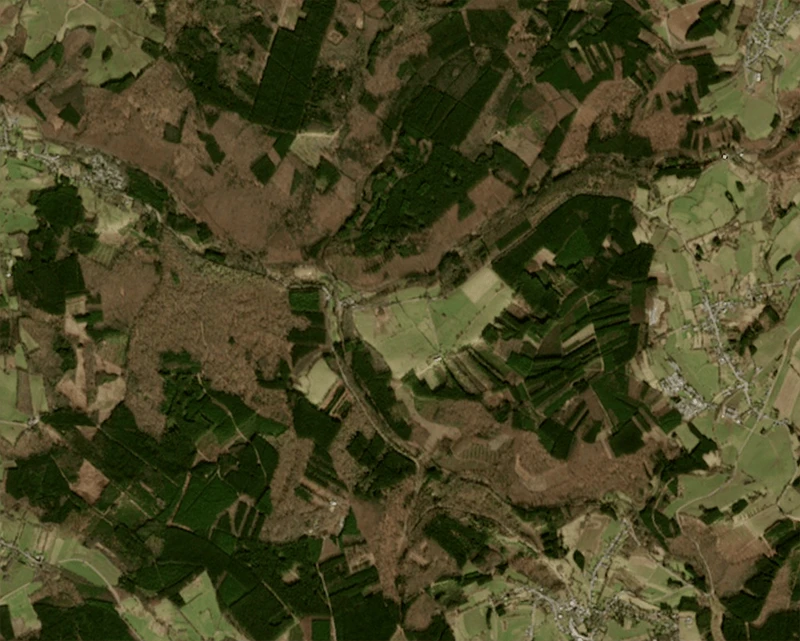
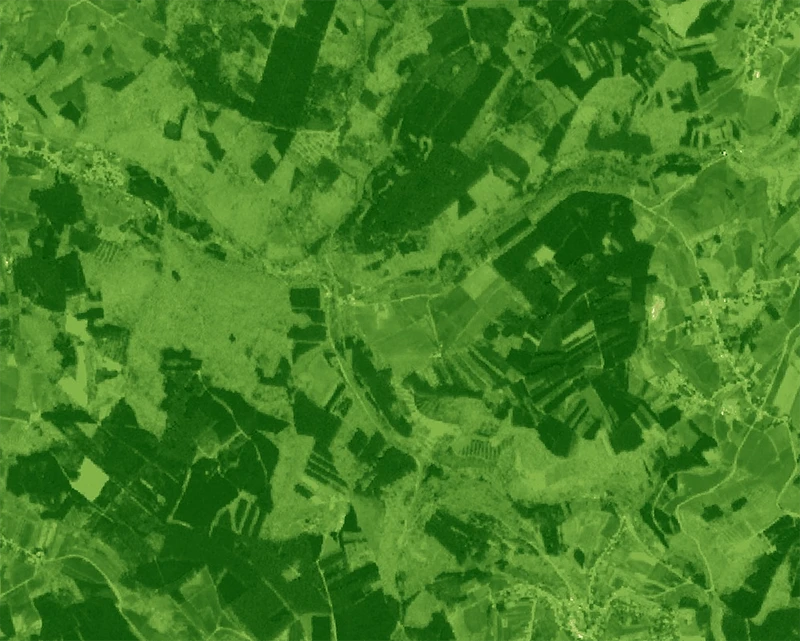
Here we see changes in colour intensity in forests in Eastern Poland over time, potentially indicating issues with forest health. This information can be used by forest managers to guide further investigations and interventions.
Białowieża Forest, Poland
Various indices and their associated colour intensities show how forest health changes over time. Variations in colour patterns represent differences in vegetation condition, enabling the identification of areas experiencing stress, decline, or recovery throughout the monitoring period.
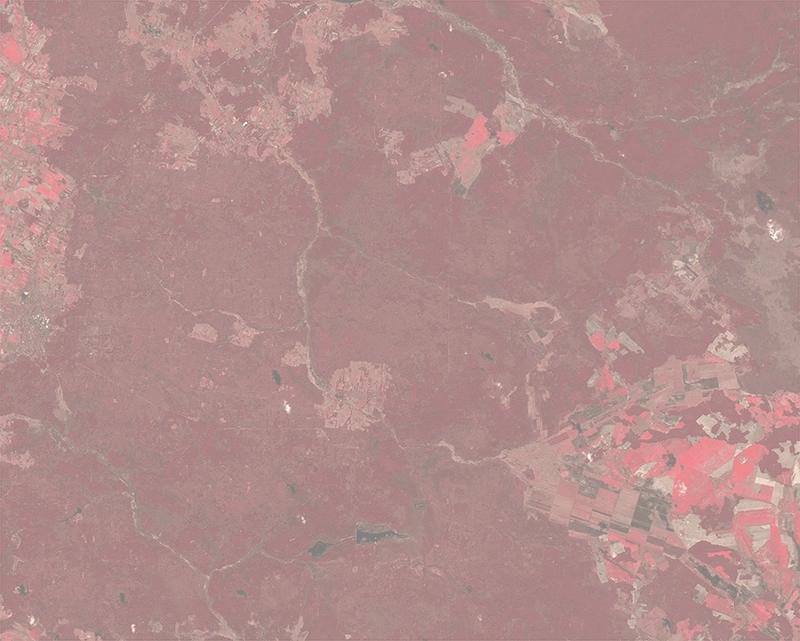
Many tree diseases also reduce photosynthetic activity, cause leaf discolouration, thinning crowns, or premature leaf loss, all of which lead to measurable changes in vegetation indices. Here, the NDRE index shows deeper red tones than in the previous image, which may suggest reduced tree health.
Here we have an NDVI image of the forest in 2018, providing a snapshot of vegetation vigour and canopy density at that time.
This 2025 Sentinel-2 NDVI image allows us to assess the state of the vegetation. By comparing it with the previous image, areas where vegetation has improved or deteriorated can be identified, with darker green being healthier vegetation and lighter green being more stressed. This can help reveal potential environmental changes or pressures on the ecosystem which forest managers could further investigate. - sources
Forest drought stress
Forest drought stress reduces water availability in trees, leading to decreased photosynthesis, canopy thinning, leaf discoloration, and premature leaf loss, all of which produce measurable changes in satellite-derived indicators and moisture-sensitive metrics.
Drought stress can be monitored indirectly using combined Sentinel-2 optical and Sentinel-1 radar data: Sentinel-2 captures changes in vegetation vigor and canopy chemistry, while Sentinel-1 detects moisture- and structure-related changes regardless of cloud cover.
NDMI (Normalized Difference Moisture Index) uses NIR (Near-infrared) and SWIR (Short-Wave Infrared) bands to estimate vegetation moisture. SWIR reflectance responds to leaf water content, while NIR is influenced by leaf structure and dry matter but not water. Combining them reduces structural effects and improves the accuracy of vegetation water content detection.
NDMI (Normalized Difference Moisture Index) measures vegetation moisture and can indicate areas of water or drought stress to forest managers. Greener colours indicate high moisture, yellow moderate moisture, orange low moisture, and red or brown very indicate drier vegetation or bare soil. (Western Kenya) - source

Forest managers can use platforms that combine satellite data with other sources—such as weather, field sensors, and historical records—to gain a holistic view of forest conditions.
These dashboards help detect issues early, monitor changes, and support more informed and timely management decisions.
An illustrative example of such a dashboard is shown below.
CLMS / ERA5
The Copernicus Land Monitoring Service (CLMS) provides long-term, consistent information that supports large-scale forest health monitoring and management.
The High-Resolution Forest Layers map forest type, tree cover density, and forest change, enabling the detection of disturbances. CORINE Land Cover adds broader land-use context by identifying long-term changes such as forest conversion, fragmentation, or afforestation that influence forest health.
Vegetation Phenology and Productivity products describe seasonal growth patterns and long-term trends in vegetation activity, helping identify abnormal timing, reduced productivity, or gradual forest decline linked to climate stress, pests, or disease.
ERA5, produced by the Copernicus Climate Change Service, supports forest health monitoring by providing consistent, long-term climate information that helps explain and anticipate forest stress. ERA5 delivers hourly data on key variables such as air temperature, precipitation, soil moisture, radiation, wind, and drought indicators, which are all critical drivers of forest condition.
Who benefits
from Copernicus?
By using Copernicus services and Sentinel data, we can consistently monitor changes in forest condition, structure, and environmental stress across large landscapes. From vegetation indices and canopy moisture to time series that reveal emerging drought, disease, or disturbance patterns, this multi-layered approach provides continuous insight into forest health.
It identifies areas repeatedly exposed to stress, enabling forest managers to target field inspections, prioritise management interventions, and apply preventative measures where they are most needed.
During extreme events such as droughts or pest outbreaks, these insights also support timely operational decisions, including adjusting management activities, allocating resources efficiently, or temporarily restricting access to protect forest ecosystems and public safety.
Explore this
further with us
Copernicus Sentinel data and many Copernicus service products are free and openly available, making it easier to scale monitoring.
EUSPA can support stakeholders by helping identify fit-for-purpose Copernicus datasets, designing meaningful indicators, and connecting with EO service providers to operationalise dashboards, reporting and alerts.
EUSPA can help interested stakeholders explore which Copernicus datasets and indicators are most relevant for their operational needs, how they can be turned into dashboards, alerts or reporting tools together with EO service providers.