direct economic losses caused by natural catastrophes in the EU between 1981 and 2024.
ECB, EIOPA - 2024
The pricing question
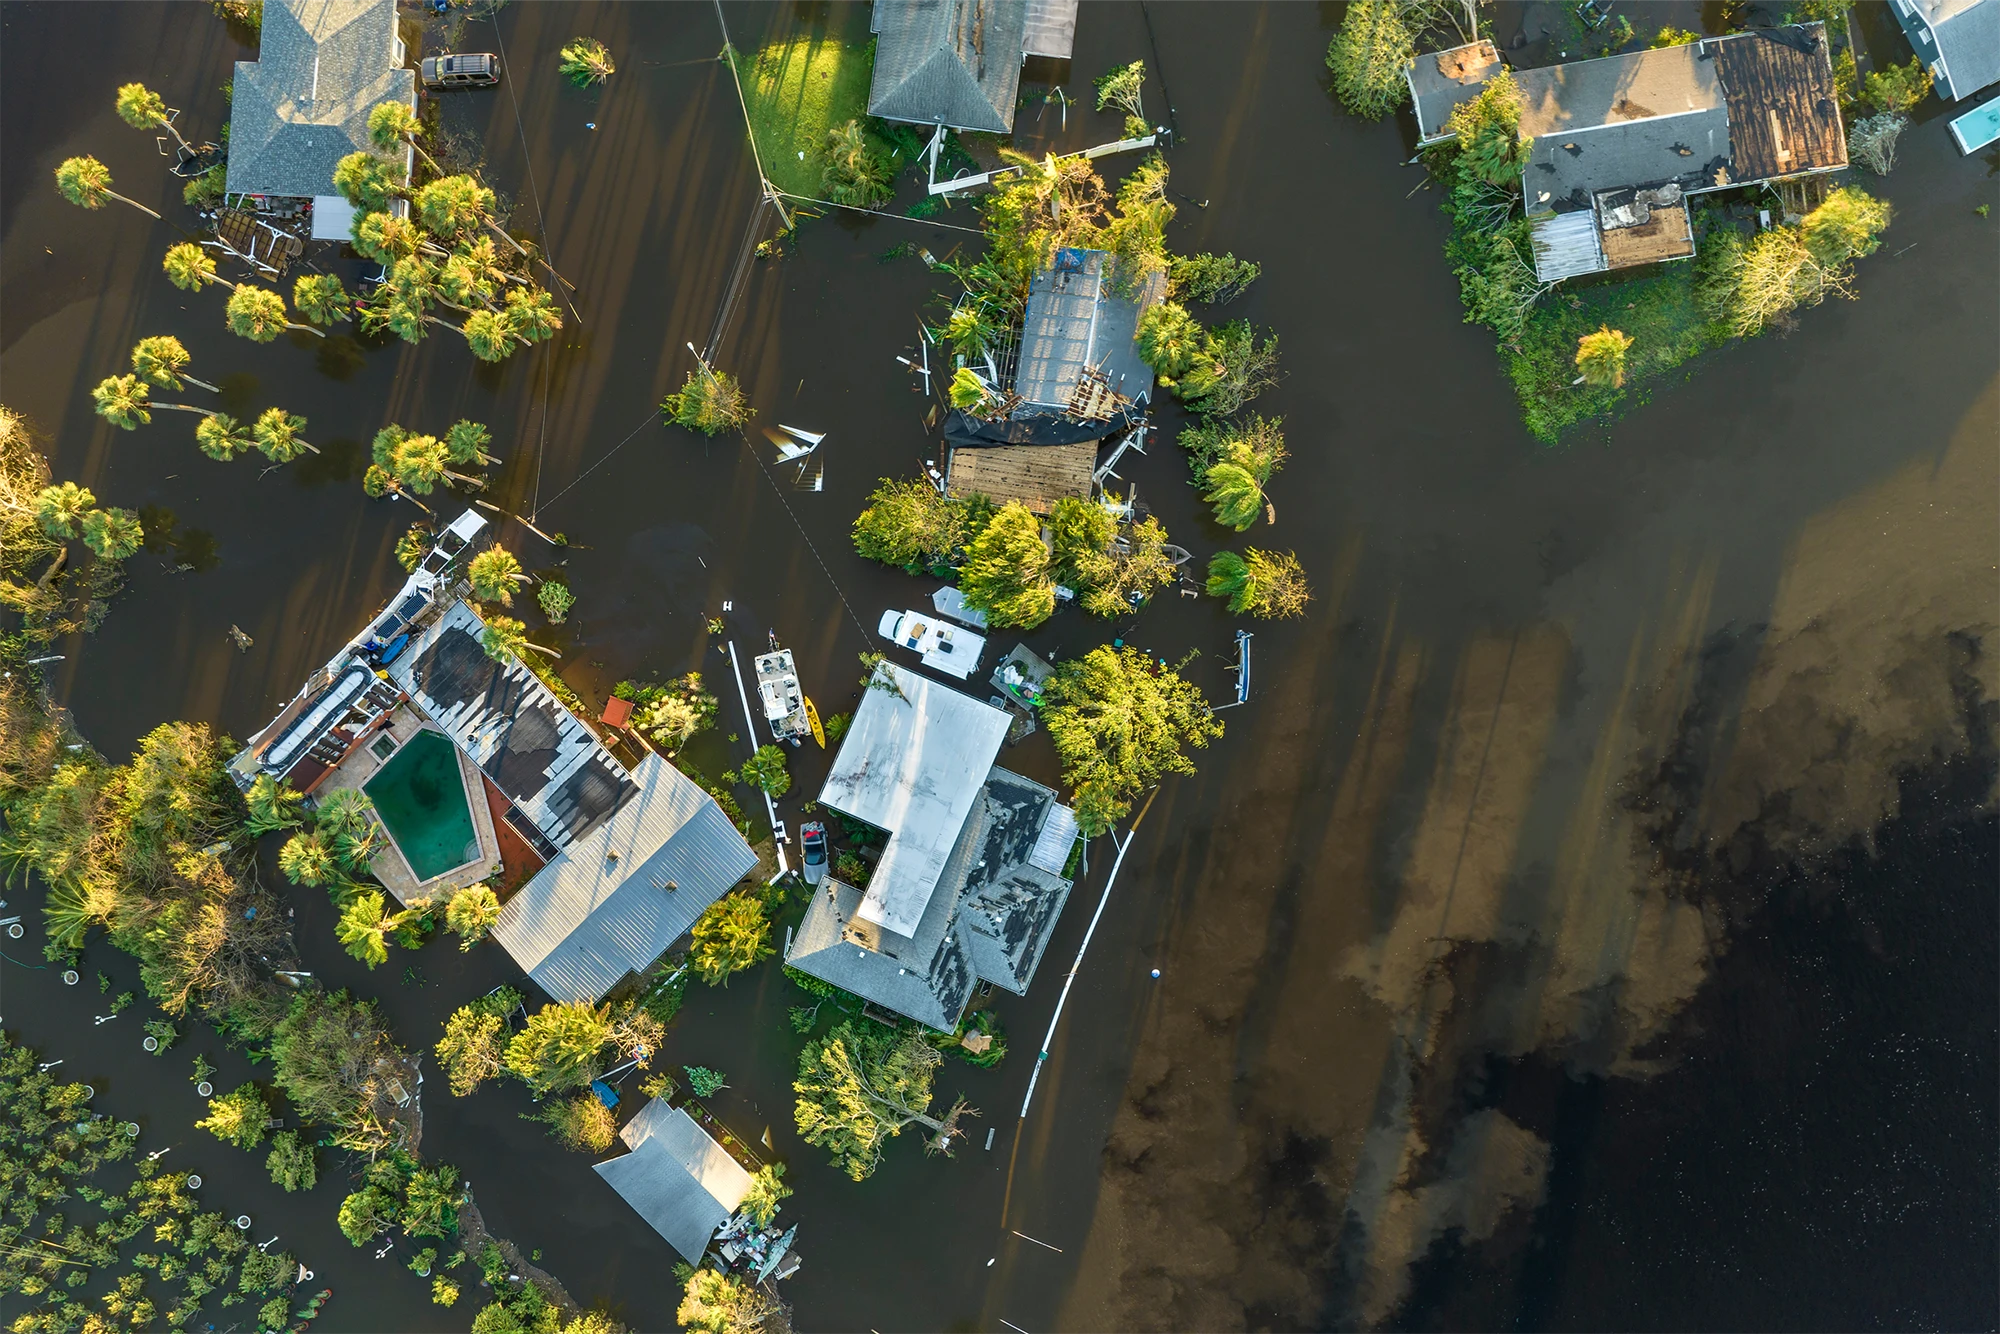
Increased exposure and the growing frequency and severity of natural catastrophes have been driving up the cost of natural catastrophes in Europe.
Envato
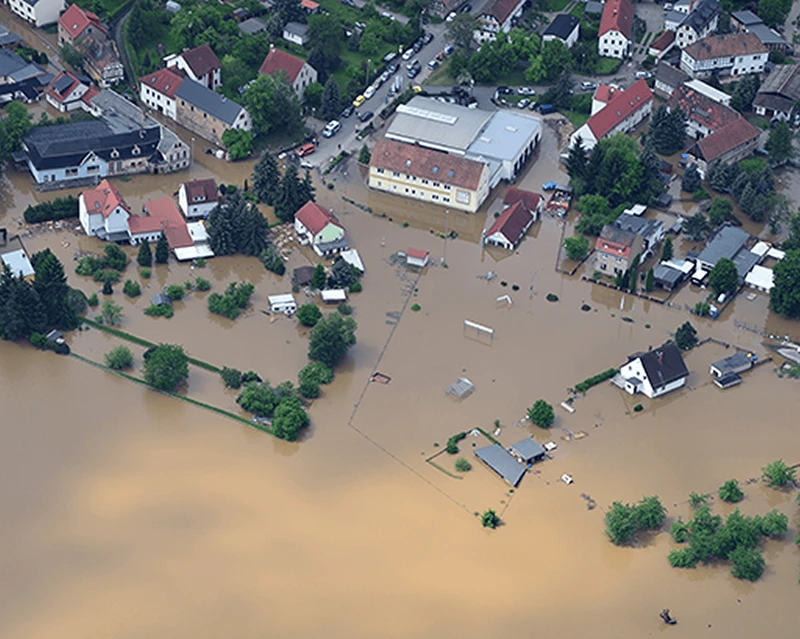
After a major flood events, the insurance sector faces a critical question: Where did it really flood, how severe was the damage, and which portfolios are exposed?
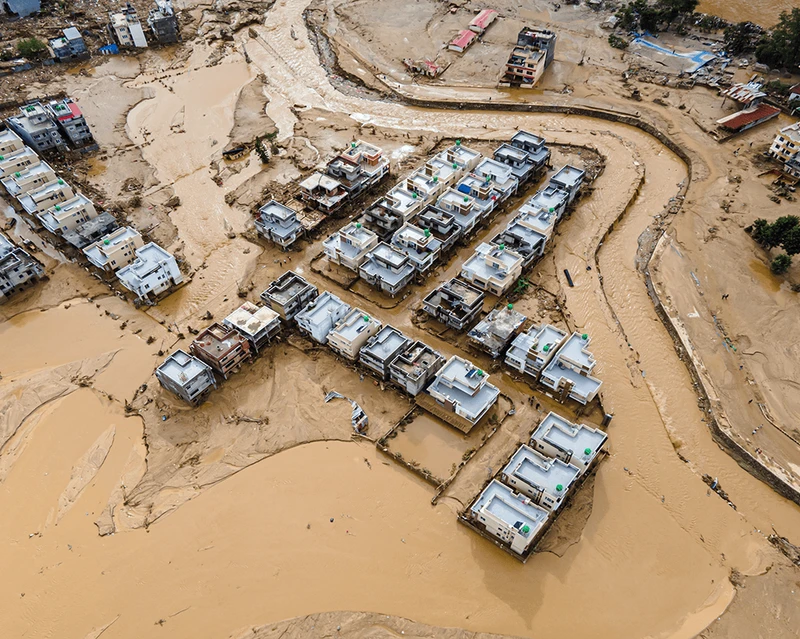
Envato
A spike in the last 4 years
Between 1981 and 2024, natural catastrophes caused more than €900 billion in direct economic losses within the EU, with one-fifth of these losses having occurred in the last four years alone.
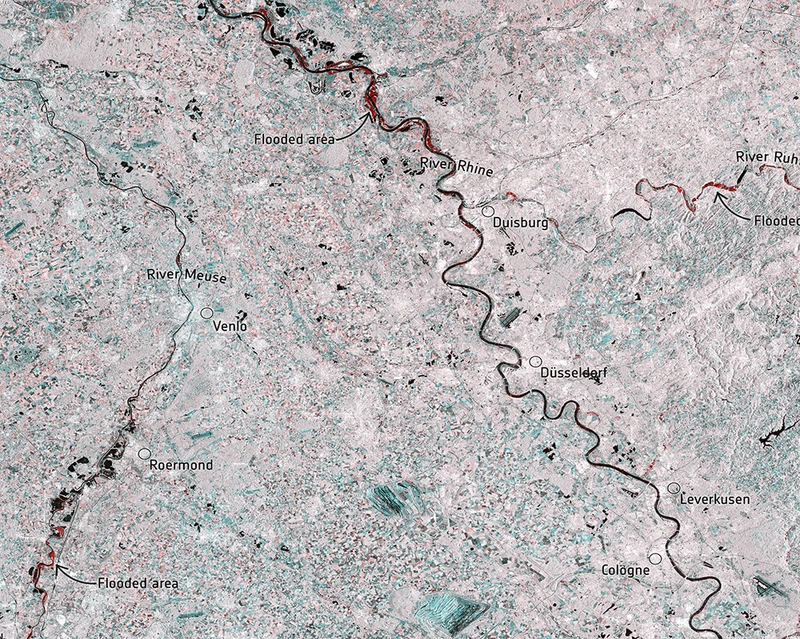
Map floods in western Europe Sentinel 1
The graph shows annual losses from natural catastrophes in the EU, 1981–2023. Each bar splits total damage into insured losses (dark blue, bottom) and uninsured losses (grey, top) — the gap between them is what households, businesses, and governments absorb directly. The trend of increasing total losses over time is clearly visible.
Seeing through the clouds
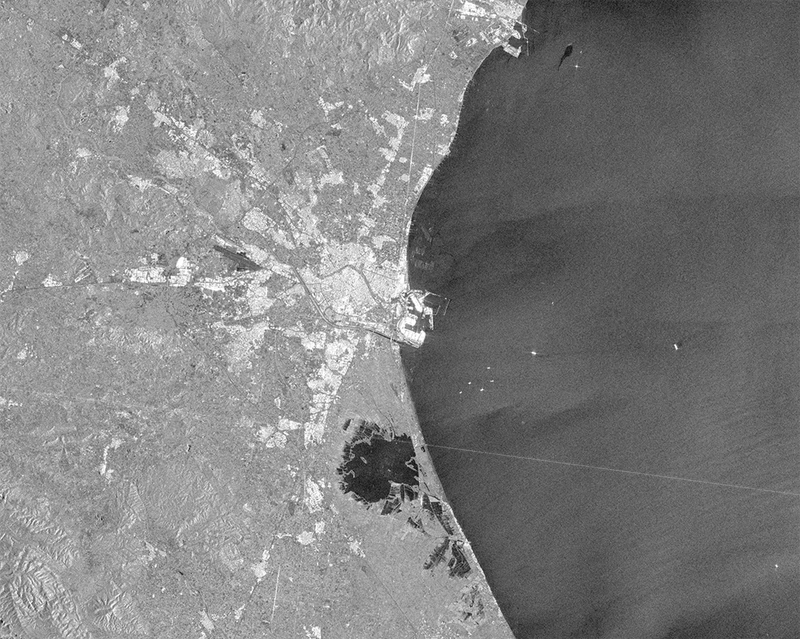
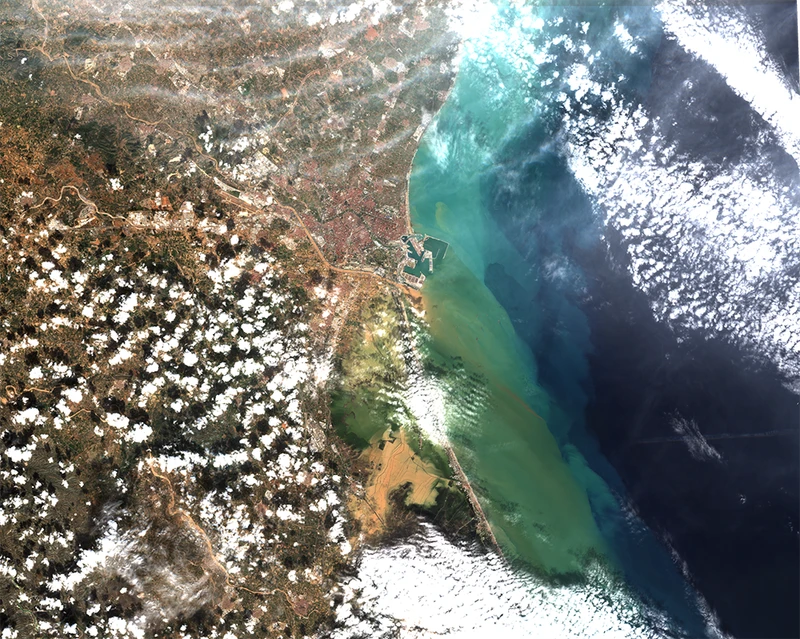
When a flood happens, insurance companies need to assess the situation quickly and plan accordingly. Copernicus Sentinel-1 radar data cuts through clouds and to map flood extent in near real time.
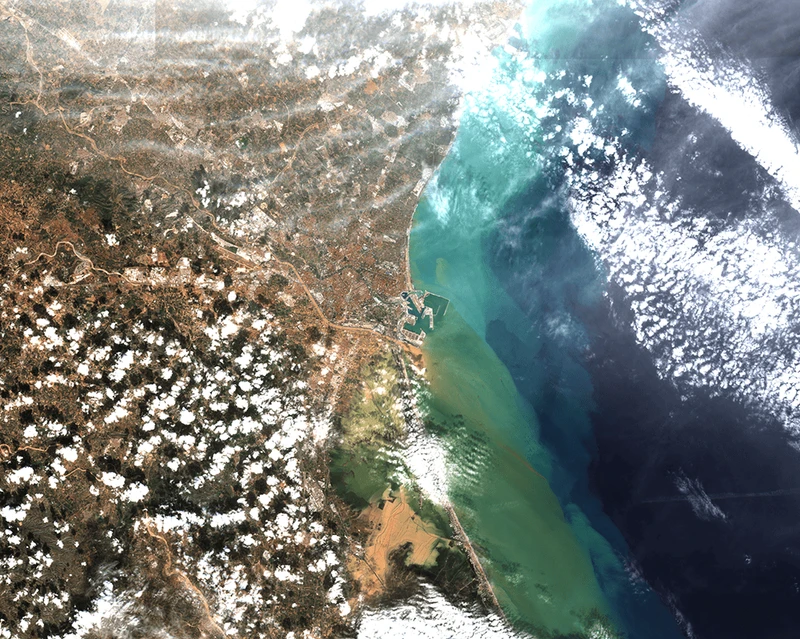
This provides an independent, auditable footprint, validating flood extents and supporting fast portfolio analysis.
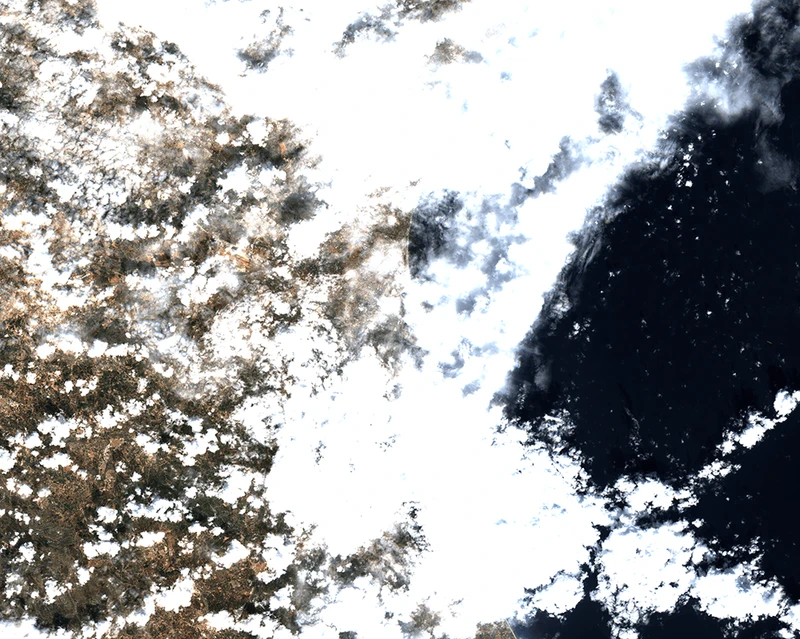
Sentinel-1 SAR operating at 20m resolution with 6–12 day revisit cycles, delivers all-weather flood monitoring capability. For major events, CEMS Rapid Mapping provides authoritative flood footprints that insurers can rely on for independent validation.
From extent to impact
Flood extent alone isn't enough. By combining satellite footprints with terrain models and land use, the insurance sector can estimate flood depth and identify high-severity corridors, turning “where did the flood happen” into “How significant was the flooding”.
Copernicus supports this by providing Sentinel-1 flood extent mapping capabilities, Copernicus-DEM terrain data and CLMS Urban Atlas and land use layers. These outputs, when integrated, provide indicative damage estimates that deliver maximum value when combined with ground truth observations and claims data.
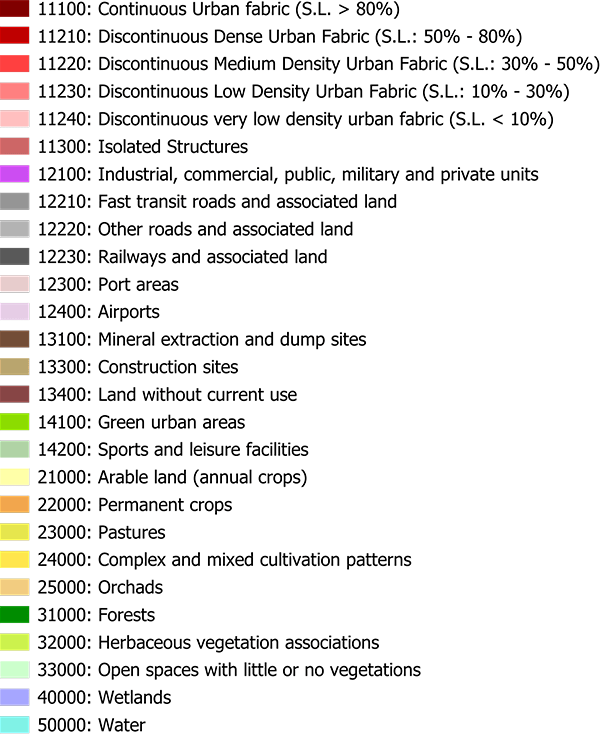
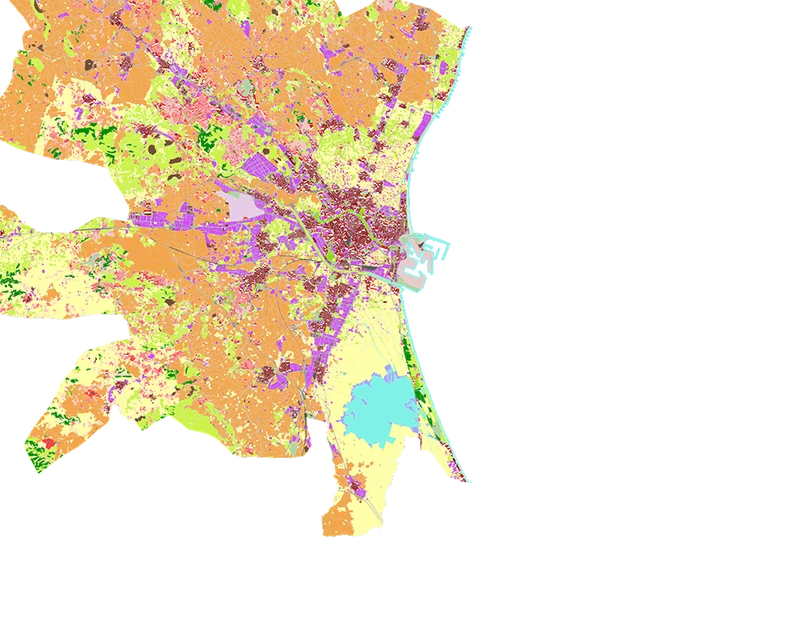
Land cover types within Valencia municipal area - CLMS Urban Atlas
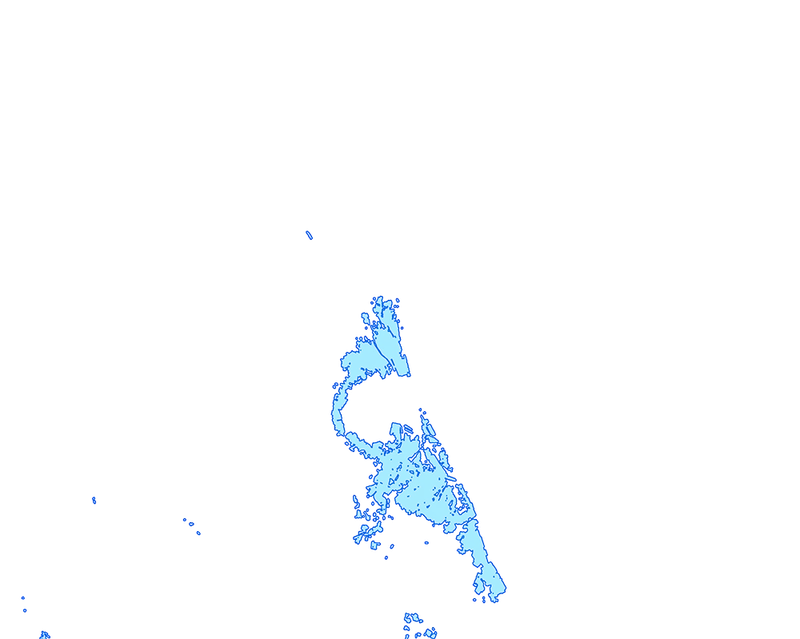
Sentinel-1 derived flooded area map of the 10/2024 Valencia event
Evidence at scale
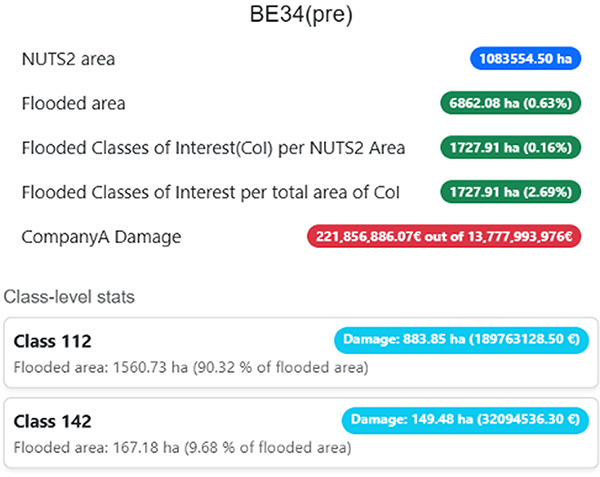
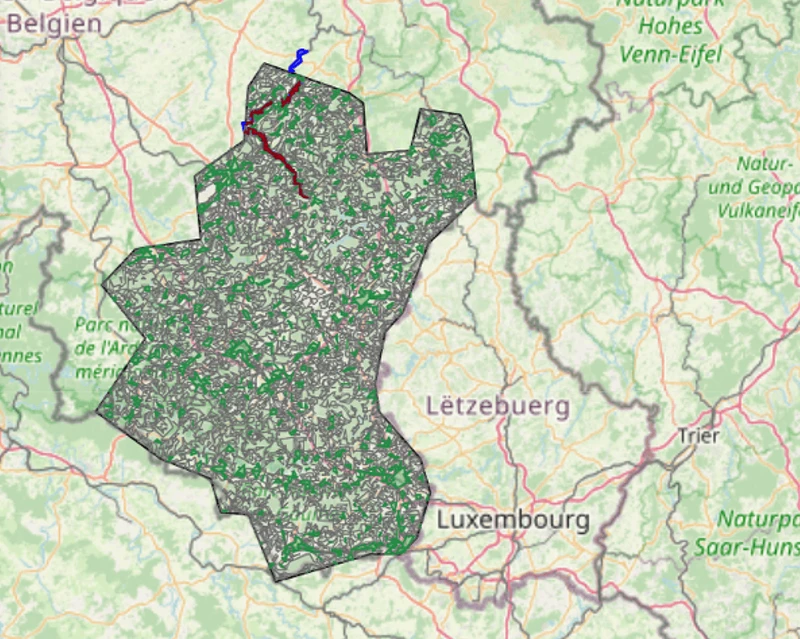
The EUSPA and EIOPA proof-of-concept, focused on the application of Copernicus data for flood event footprint analysis, damage estimation as well as risk modelling shows Copernicus can deliver NUTS-2 aggregated damage estimate.
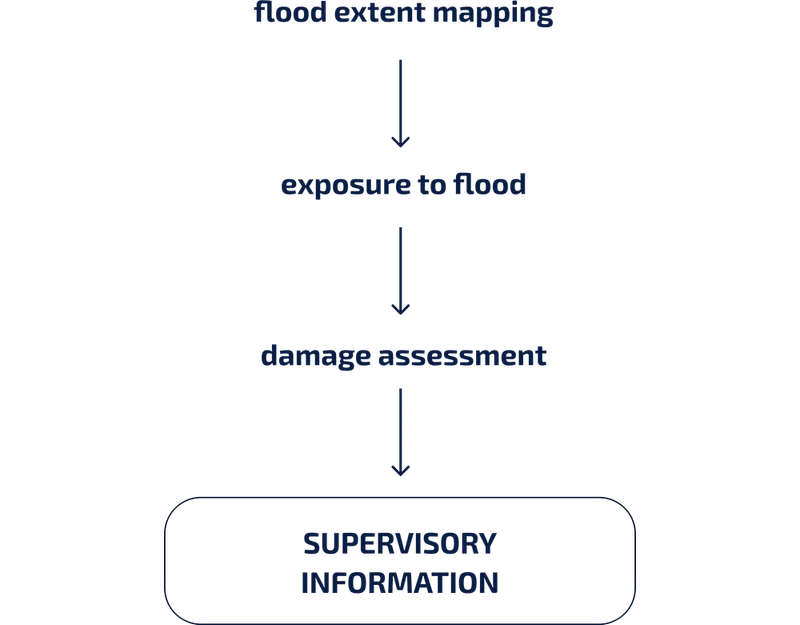
This helps in matching regulatory reporting formats and enabling cross-market comparability, while supporting portfolio steering, benchmarking, and supervisory oversight.
The methodology applied combines Sentinel-1 flood extent with DEM-based depth estimation and CORINE land cover classification. This approach is transparent, built on sound scientific foundations, reproducible, and scalable across Europe, ensuring applicability and availability regardless of jurisdictions.
From data to decisions
Copernicus-based workflows turn satellite evidence into underwriting decisions: accumulation monitoring, model validation, pricing adjustments, and post-event triage.
The result? Faster, more accurate post-event analytics.
Sentinel-2 data gives us a near real-time, asset level monitoring capabilities, and the vast Copernicus data archive gives us the possibility of assessing historical trends.“
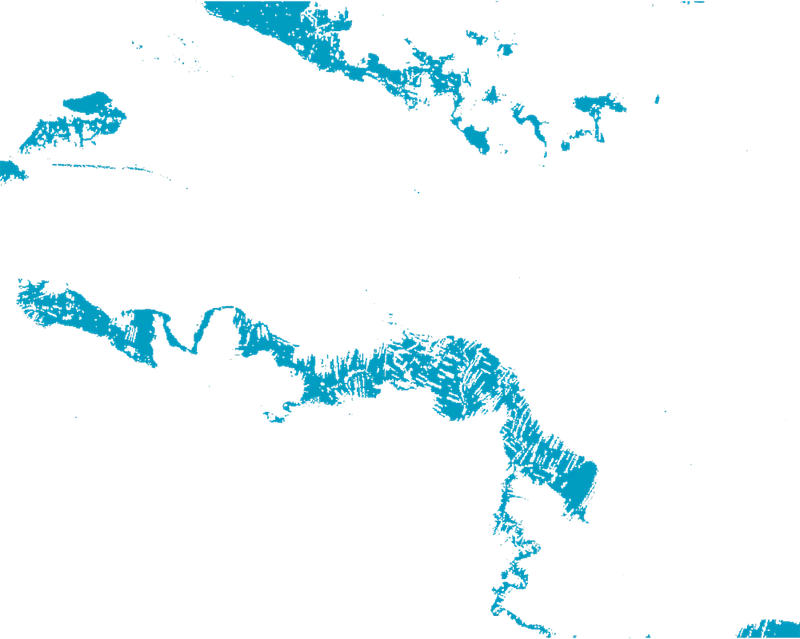
While Sentinel-1 SAR gives us the ability to drive actionable asset level information, exactly when needed, regardless of weather conditions
By fusing Copernicus data with other data sets available on Member State level, the insurance sector can connect effects of natural events to specific assets.
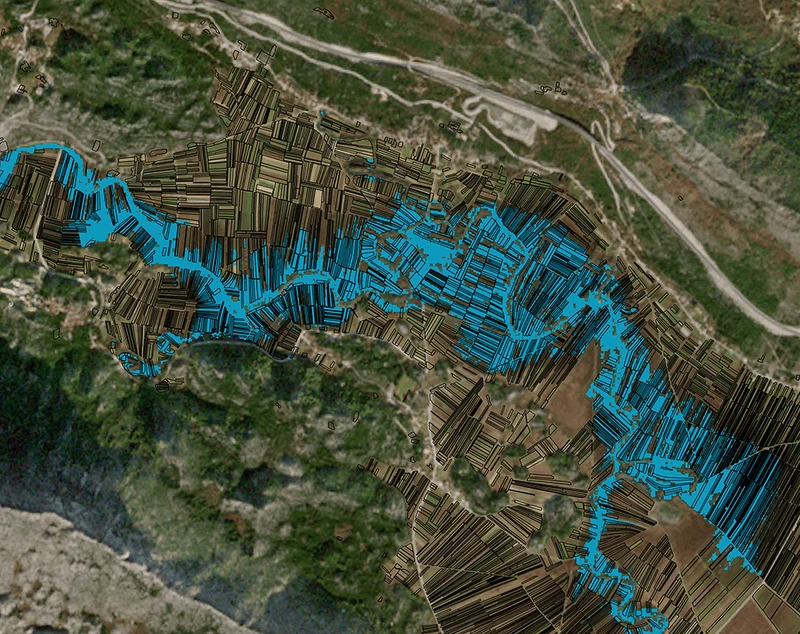
Enabling informed decision making, asset-level claim verifications, and pricing adjustments. Beyond individual events, this methodology also provides a trustworthy, scalable, and transferable source of data for insurance risk modelling.
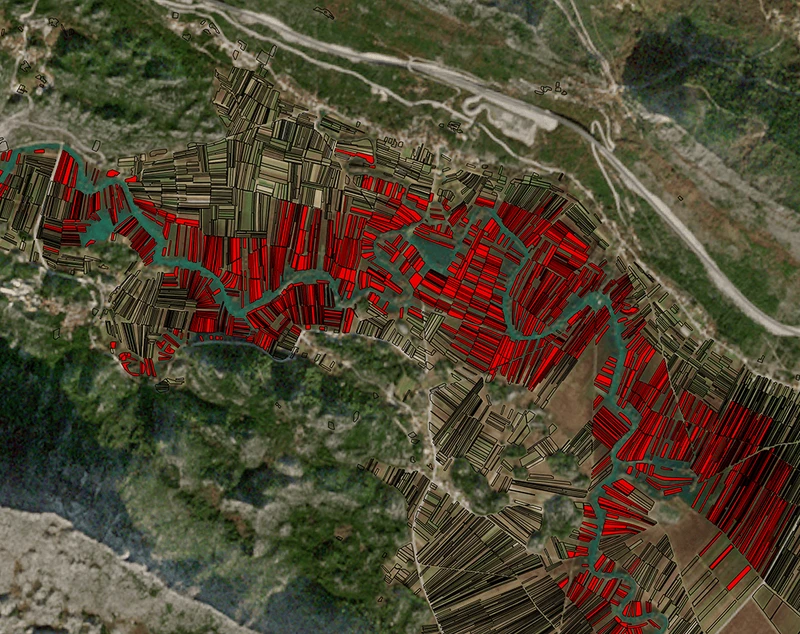
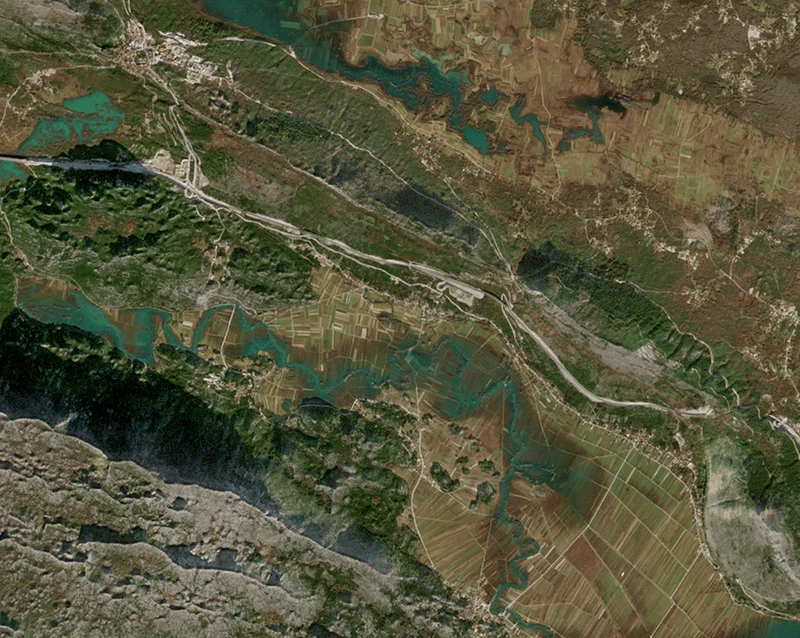
Percentage of crop type affected by the January 2026 flooding - Vrgorac, Croatia
Out of 480ha of impacted agricultural land
The model gap
Traditional physical risk models and maps show where catastrophic events are likely to occur. Event footprints tell us where they actually did. The gap between modelled and observed is where insurers face mispriced risk and blind spots in their portfolios. Satellite-based event footprint analysis adds significant value to the risk modelling workflows by grounding assumptions in observed reality, validating exposure, and turning every event into sharper insight for the next one.
Thanks to Copernicus, these observations are available globally, consistently, and openly — turning every corner of the planet into a validation dataset.
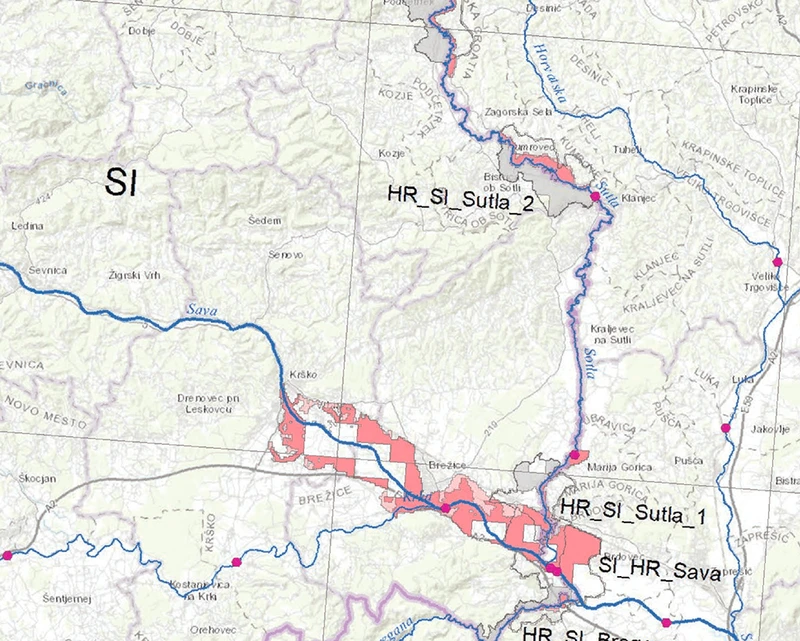
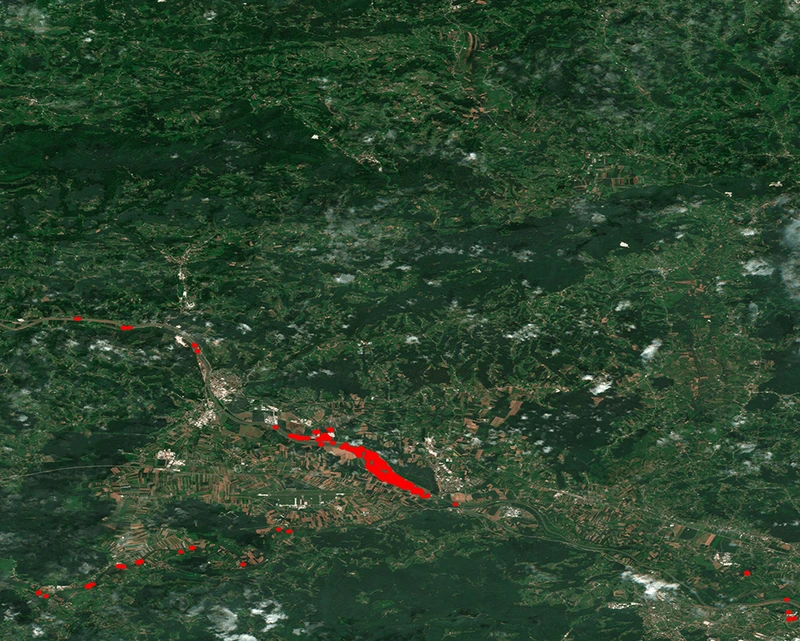
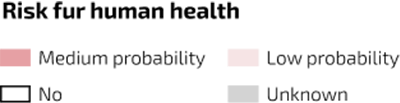
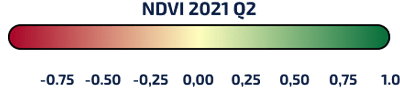
flood risk map
(Slovenia)
Explore this
further with us
Copernicus provides free, open, auditable flood data. The insurance sector can access ready-to-use products (CEMS) or work with EO service providers for custom analytics. Integration with exposure and claims data delivers decision-grade insights.
EUSPA can help interested stakeholders explore which Copernicus datasets and indicators are most relevant for their operational needs, how they can be turned into dashboards, alerts or reporting tools together with EO service providers.